
The Anatomy of a Perfect Voice Agent Analytics Dashboard
Last month, a customer's voice agent started failing at 3am. By 9am, when the ops team got in, they'd lost 400 calls. The dashboard showed everything green - call volume was normal, average latency looked fine, no alerts had fired.
The problem? Their dashboard tracked averages. The agent wasn't failing completely; it was failing on a specific intent path that represented 15% of calls. That 15% had 8-second response times. The other 85% masked it in the averages.
This is the difference between a dashboard built for human agents and one built for LLMs. Traditional call center tools measure AHT, resolution rate, and CSAT. They worked when every call followed a predictable script. But AI voice agents are probabilistic. They branch. They sometimes hallucinate. The metrics that matter are different.
Voice-AI failures often hide in latency spikes, prompt drifts, or sentiment swings; traditional dashboards are not built to detect and analyze these signals. Analyzing and debugging LLM-powered voice agents requires end-to-end visibility into model performance, with tools that can surface issues in real time and pinpoint exactly where and why things go wrong.
Quick filter: If your dashboard can’t answer “why did users hang up today?” it’s not a production dashboard yet.
If you’re deploying voice AI agents at scale, or planning to, you’ll need a modern dashboard that is designed to measure your agent’s performance.
Why Legacy Call-Center Analytics Fall Short
Legacy analytics tools were designed for human workflows and measure metrics that matter to human agents. They help teams track high-level indicators like average call handling time (AHT), whether human support agents followed scripts, and customer satisfaction score (CSAT).
But for LLM-powered voice agents, these metrics are incompatible. Unlike human agents, LLMs are probabilistic, operate in real time, and behave according to different model versions and prompt templates. They don’t take breaks or perform effort-based labor, so productivity metrics like AHT do not reflect efficiency. In fact, a longer AHT could indicate more thorough support by an LLM, rather than inefficiency.
Similarly, CSAT often fails as a signal because it doesn’t capture AI-specific quality indicators like factual accuracy or conversational flow. Additionally, users often skip rating automated interactions, creating skewed data with low response rates.
More importantly, legacy tools weren’t built to track the metrics that matter for LLMs. Metrics such as real-time p90 latency, prompt compliance and time to first word (TTFW). Without visibility into how well a model follows its intended behavior, teams are unable to accurately assess agent performance, tie behavior to business outcomes, or make informed improvements that drive customer satisfaction.
KPIs 101 – The Core Questions Your Dashboard Must Answer
The core questions your dashboard must answer can be broken down into four categories.
| KPI category | Example metrics | Why it matters |
|---|---|---|
| Infrastructure | TTFW, latency p50/p90, call volume | Detects system health and responsiveness |
| Execution | Guardrail pass rate, context retention | Validates the agent did the right thing |
| User reaction | Interruptions, silence gaps | Surfaces frustration in real time |
| Outcome | Completion rate, success vs fail | Connects behavior to business results |
Infrastructure KPIs determine how well your voice AI agent is performing, focusing on how well your agents process, generate and deliver conversations.
-
Number of calls: The overall number of calls handled. Sudden drops or spikes can signal deployment issues. For instance, if there are only five calls logged on a specific day compared to the daily average of 200, this suggests there may be a deployment issue.
-
Time to First Word (TTFW): Time elapsed from when the user stops speaking to when the AI agent begins its first audio response. This metric is crucial for maintaining a natural conversational rhythm that prevents customers from feeling like they're talking to a slow unresponsive system.
-
Call Duration p50: Half of all calls are shorter than this duration. This represents the median call length.
-
Call Duration p90: 90% of all calls are shorter than this duration. This helps identify outlier calls that are significantly longer than average
-
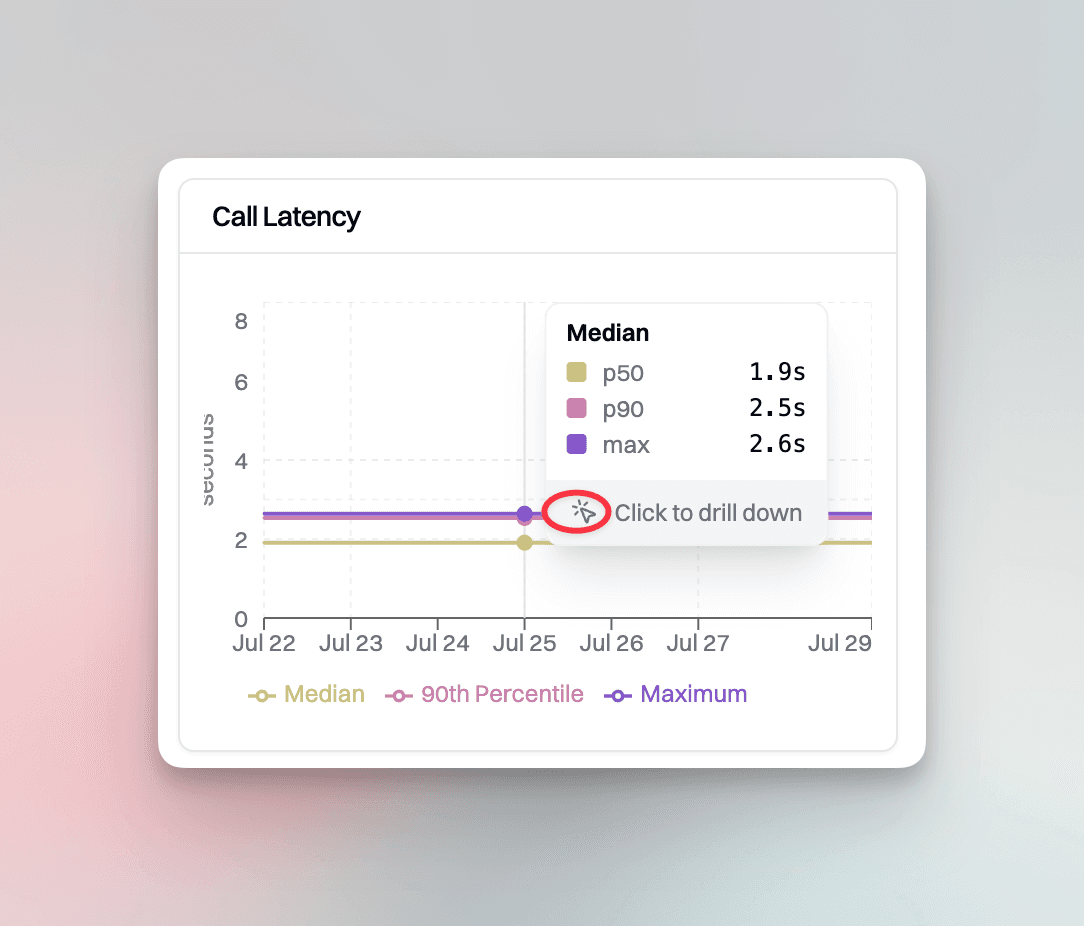
Call Latency p50: The response time where 50% of requests are served faster than this value. This is typically the average user experience.
-
Call Latency p90: The response time where 90% of requests are served faster than this value. This reveals the "typical worst-case scenario" that most users encounter.
It’s essential to track call latency p50/p90 separately because they capture different aspects of the user experience. The average latency p50 figure may seem fine, but it can hide variability. For instance, a system showing 300ms p50 latency may still have 10% of calls experiencing 2+ second delays.
That’s what p90 latency reveals, the users experiencing the 2+ second delays. High p90 latency often signals infrastructure issues, such as model failures, overloads or API constraints.
We’ve seen teams celebrate “fast” average latency while their p90 quietly doubled. CSAT followed a week later.
Execution KPIs tell you whether the voice agent performed as designed during the conversation.
-
Longest Monologue: This is the duration of the longest uninterrupted AI response. Long monologues may indicate that the agent is failing to provide concise responses or is misinterpreting the user's query/intent.
-
Guardrail Pass Rate: Tracks how often the agent met predefined actions. For example, "Did the agent confirm the appointment?" or "Was the order completed?"
-
Context Management: This is the agent's ability to retain and use relevant information across turns.
User reaction KPIs surface how users experience and react to the conversation.
- User Interruptions: Tracks how often users barge in or speak over the agent. Multiple interruptions per call can signify impatience or dissatisfaction.
Outcome KPIs measure the final impact of the conversation. These metrics focus on whether the voice agent successfully completed its goal, such as booking an appointment, or completing a transaction.
-
Action completed: An indicator of whether the desired task was completed. This is typically tied to a guardrail.
-
% Success vs % Fail: Comparative outcome scoring derived from guardrails. The ratio of successful task completions versus failures across all calls. A high failure rate can suggest issues with the model's ability to interpret intent and context of the specific conversation.
Outside of voice agent KPIs, it's also important to have general business KPIs, benchmarked against current industry standards. According to Sobot, the Average Speed of Answer (ASA) target is ≤ 29 seconds. Teams should ensure that customers aren't waiting on the phone too long before being served by an agent.
Likewise, customer satisfaction is also important, a CSAT score of 75% or higher is considered good. On the performance side, First Call Resolution (FCR) is linked to satisfaction; for every 1% increase in FCR, there's typically a 1% gain in CSAT.
Dashboard Evaluation Criteria: The 7-Point Checklist
Use this checklist to evaluate whether your voice agent analytics dashboard meets production requirements:
| # | Criterion | What to Look For | Priority |
|---|---|---|---|
| 1 | Real-time metrics | Live p50/p90 latency, TTFW, call volume updating in real-time | Critical |
| 2 | Percentile tracking | P50, P90, P99 latency (not just averages) | Critical |
| 3 | One-click drill-downs | Anomaly → transcript → audio in seconds | Critical |
| 4 | Custom guardrails | Define business-specific success criteria | High |
| 5 | Alerting integration | Slack/webhook notifications for threshold breaches | High |
| 6 | Multi-agent filtering | Isolate metrics by agent, environment, date range | Medium |
| 7 | Ops loop integration | Detect → Diagnose → Respond → Validate workflow | Medium |
Scoring: 6-7 criteria met = production-ready | 4-5 = gaps to address | <4 = significant upgrade needed
Quick-Start Template: For a copy-paste dashboard template with the 6 essential metrics, chart recommendations, and executive report format, see Voice Agent Dashboard Template.
Inside Hammingʼs Live Calls Dashboard – Metric-by-Metric Walkthrough
A voice AI analytics dashboard should provide real-time visibility into every aspect of the voice conversation.
Key metrics include a call-volume bar chart with interactive drill-downs that let engineers explore spikes and dips in traffic in real time.
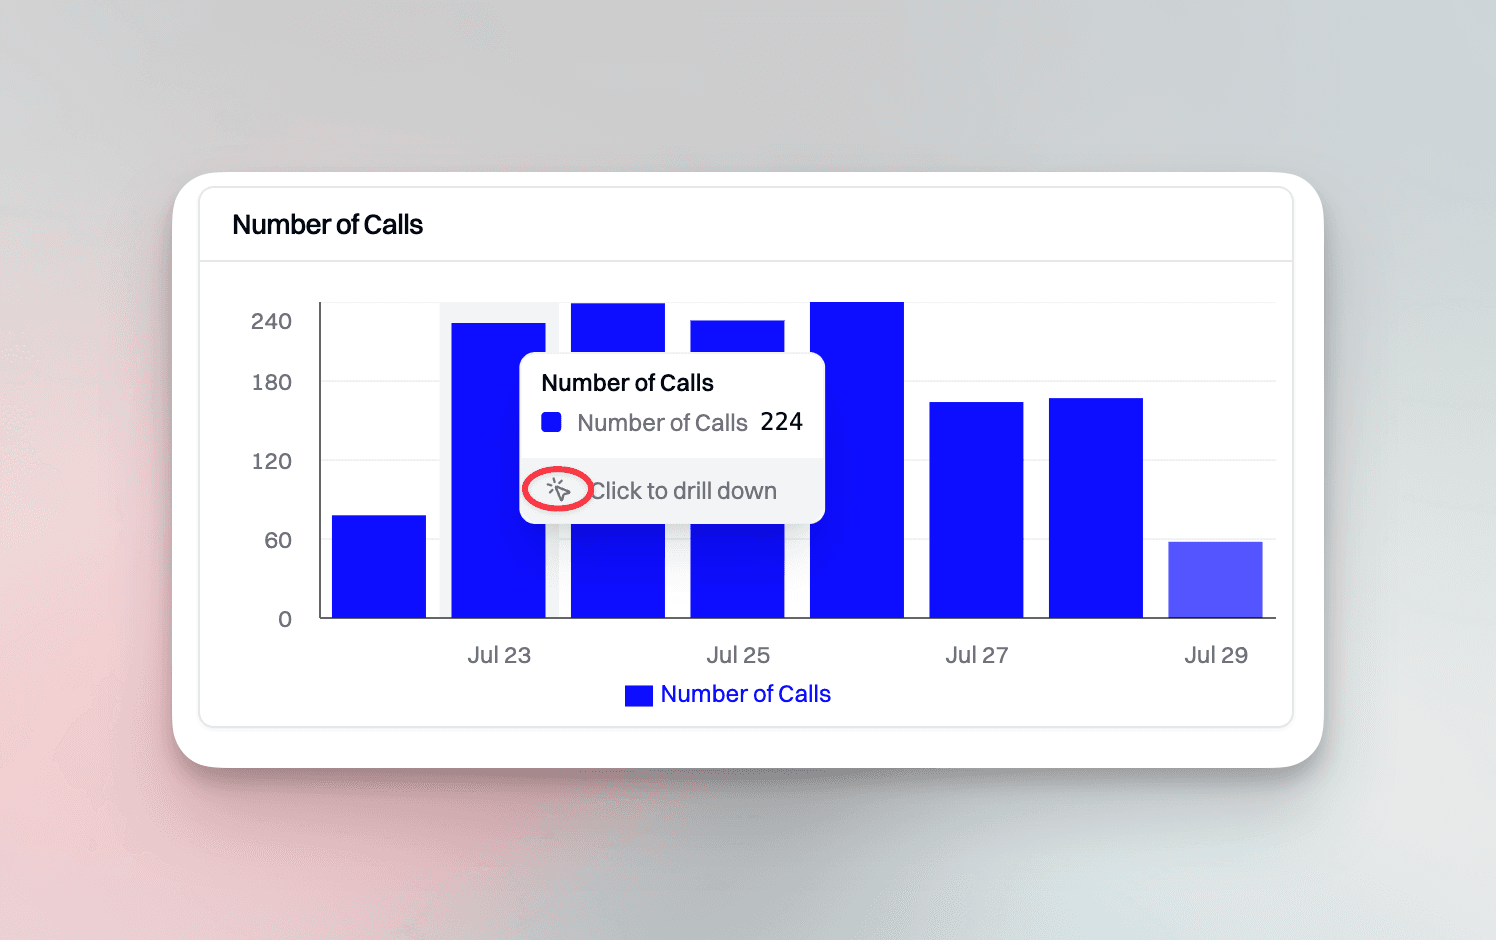
One-click drill-down is essential for incident response. During outages or sudden performance drops, speed is everything and engineers need immediate access to root cause data without navigating across multiple interfaces. For instance, if the number of calls suddenly drops, teams should be able to click directly into that data point and instantly surface affected transcripts, latency metrics and guardrail metrics.
Another key metric is a success/fail line chart that displays the success of a call, based on the performance of a specific guardrail. Spikes in the fail rate or dips in the success rate can signal issues with model behavior.
The latency panel tracks key percentiles, including p50 (median), p90, and max latency over time. Hamming’s latency panel is also designed to surface zero-second median values. These edge cases are often missed by traditional tools but are critical for identifying the model’s latency.
Status bars provide a high-level snapshot of call outcomes, allowing teams to get an overview of calls. On Hamming’s dashboard you can filter and isolate sessions by status “Ended”, “Canceled”, or “Error”. These filters are essential for rapid root cause analysis (RCA).
Designing for Usability – Filters, Drill-Downs & Alerts
Your dashboard should also act as a command center for operations, QA, and engineering teams.
Filters
During incidents, agent, date-range, and tag filters allow teams to quickly isolate affected sessions for quick debugging. Examples of filters include the agent, environment (whether it’s in testing or production) or scoring filters etc. In multi-agent environments, the agent filter allows teams to isolate performance metrics, transcript data, and error patterns of a specific agent. This is especially ideal for testing model variations between different agents.
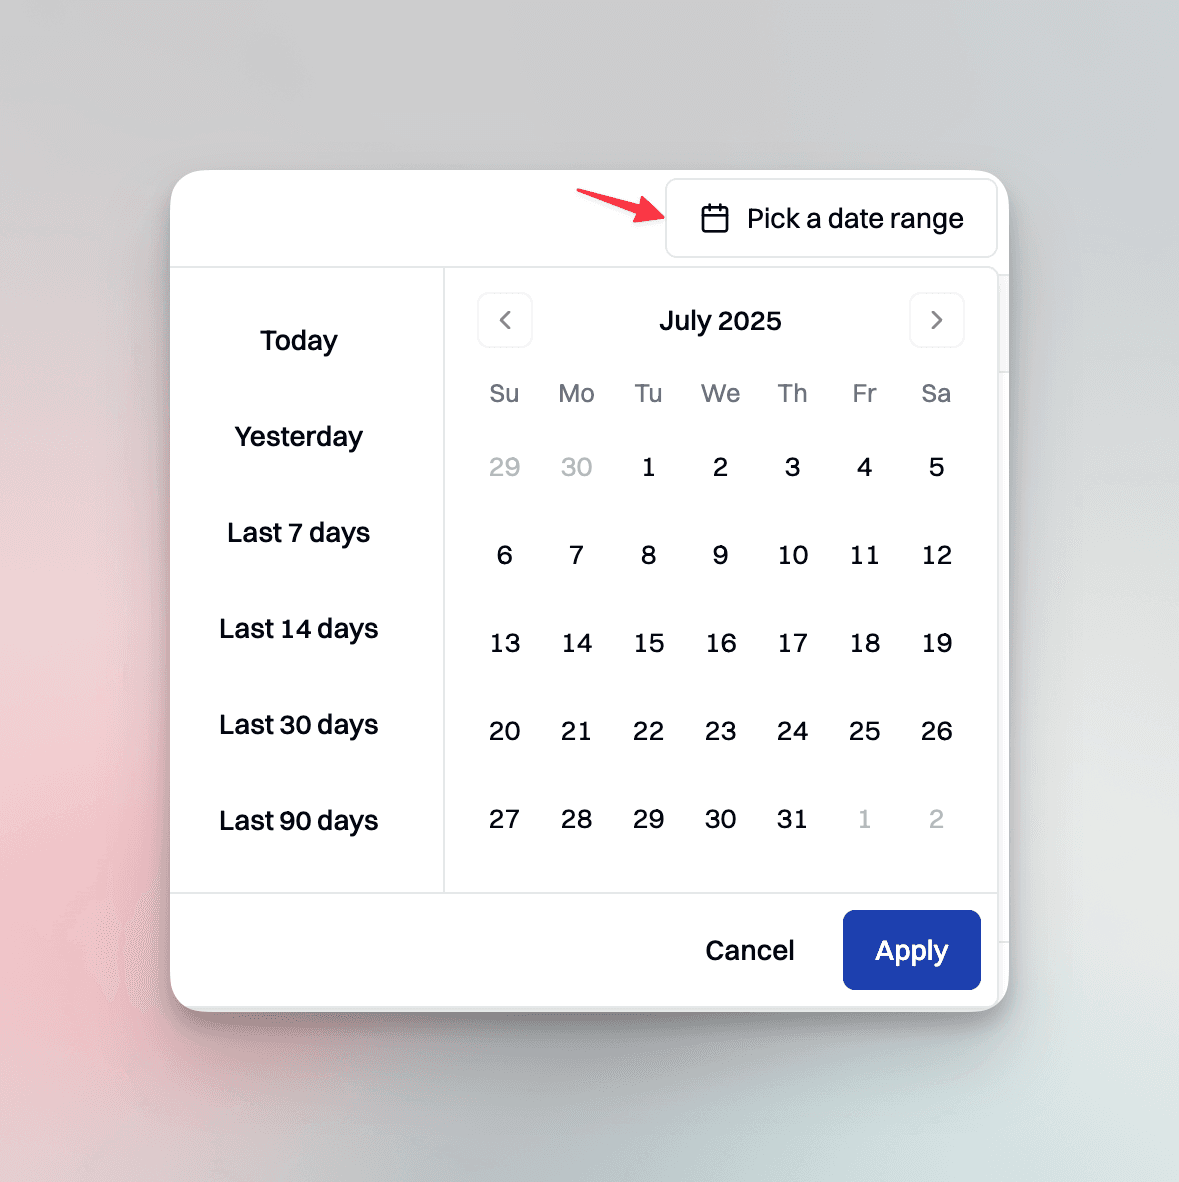
Date range filters are essential for tracking trends and understanding the correlation between deployment issues and incident windows. It’s also useful for understanding customer behavior, for instance if customers appear more agitated and frustrated towards the end of the month or later in the day.
One click drill downs
With one-click drill-downs to transcripts and audio, engineers can move from high-level metrics to root cause analysis in seconds. For example, a spike in p90 latency or a sudden drop in success rate should lead directly from the anomaly to the affected call transcript, then to the raw audio. This end-to-end traceability enables engineers and QA teams to investigate issues without switching tools or losing context.
Custom alerts
Custom alert rules, such as triggering Slack or webhook notifications when p90 latency exceeds 2s or success rates fall below 80%, ensure teams are notified the moment something breaks. With Hamming, you can set custom alerts or use recommended alerts.
From Insight to Action – Embedding Analytics into the Ops Loop
Embedding analytics into the operations loop means closing the gap between insight and action, leading to faster remediation. This requires a tight feedback loop, where voice AI observability tools feed directly into engineering and operations workflows. At Hamming, we frame this as a four-step process:
1. Detect the anomaly
Detection begins with a combination of ML-based anomaly detection and rule-based validation. For instance, p90 latency > 2s, success rate < 80%). When an anomaly is detected, alerts are pushed instantly to Slack.
2. Diagnose the issue
Once an alert is sent to Slack with the metadata, such as affected agent, timestamp and guardrail failures. Engineers can log into the dashboard and drill down from high-level metrics to individual transcripts and audio to get a closer look and understanding of the issue.
3. Respond and resolve
After diagnosing the issue, teams coordinate across engineering and ops to deploy the appropriate fix. This might include a prompt rewrite, fixing ASR problems, or deploying a model update.
4. Monitor and validate the fix
The final step is continuous monitoring and validation. Teams track whether key metrics return to baseline using real-time dashboards and p50/p90 trendlines. For example, after a latency-related incident, TTFW dropping back below the 500ms baseline indicates that responsiveness has been restored. Synthetic "heartbeat" tests simulate key interactions to ensure the issue is resolved and doesn’t resurface.
Common Pitfalls When Building Analytics Dashboards
Here are the three main common pitfalls teams run into when designing analytics dashboards for voice AI agents:
Misrepresenting latency metrics
One of the most common mistakes is relying on averages instead of percentiles to measure latency. Averages mask performance outliers and can inaccurately reflect the user experience. For instance, a few extremely slow responses can be hidden by many fast responses or an average latency of 500ms might hide that 20% of users experience >3 second delays. Percentiles give a more complete picture. They reveal the shape of the latency distribution and help engineers pinpoint and prioritize systemic issues that averages hide.
Missing sentiment dimensions
Many dashboards focus purely on numerical metrics like latency, TTFW and success rates, while overlooking user sentiment. A call that was “successful” might still deliver a poor experience if the user was frustrated or asked to repeat themselves numerous times. By creating these custom sentiment metrics like frustration checkers, and repetition checkers, teams can identify user experience issues even when guardrails pass.
No visibility or traceability to raw conversations
A lack of visibility or traceability to raw conversations slows down root cause analysis. When teams can’t easily trace a failed guardrail or latency spike back to the exact transcript or audio snippet, debugging and resolution becomes harder. Hamming supports one-click drill-downs from any metric directly to the underlying transcript and audio.
Emerging Trends for 2025 – Real-Time AI & Sentiment
As voice AI becomes more widely adopted across industries, the need for end to end AI voice observability is crucial. Traditional call center dashboards weren’t designed for LLM-powered agents; they don’t capture latency spikes, track prompt compliance, or user sentiment. Additionally, traditional call center analytics tools don’t offer Live Call Monitoring, forcing QA teams and engineers to play catch up post-call and after customers are dissatisfied.
Teams need multimodal analytics dashboards that not only capture voice, text, and sentiment, but also correlate them with infrastructure latency, execution behavior, and business outcomes. More importantly, engineers need the ability to drill down from a failed guardrail or anomaly directly into transcripts and audio, enabling real time debugging and allowing them to share findings with the team, like they would with Cloudwatch Logs.
If you're building or scaling voice AI in production, having the right observability tool makes a difference. Curious to see how Hamming's voice agent analytics dashboard works in real time? Request a demo.
